
Creating personas to communicate newsroom data literacy
Industry Dive’s editorial leadership wanted to know where our newsroom stood on data usage and tooling so they could more strategically empower editors and reporters to use data in their storytelling. I created a user survey and conducted in-person interviews to achieve the editorial operations team’s goals:
- Understand why and how editors work with data and the barriers they encounter with current processes and tools.
- Define differences in data competencies across the newsroom.
- Identify themes and areas for improvement to give editorial a path forward for process, training and tooling improvements.
The resulting deliverable synthesized the survey results and user interviews into personas that could communicate my high-level takeaways to stakeholders.
The survey
To establish a general understanding of the state of data among editors and reporters, I developed a survey for the 70-member team. The survey gathered respondent demographics and information on four key areas: data usage to tell stories, analysis, visualization and tooling.
Survey goals:
- Understand frequency of using data in articles.
- Record the tools the teams use to accomplish tasks and the size of data reporters and editors manipulate and/or represent.
- Gather perceived competency with analysis and visualization.
- Record user limitations and concerns.
- Identify perceived availability of resources and support.
- Receive direct feedback on the editorial team’s data literacy efforts.
Forty-eight members of the editorial team from all 16 of our publications responded to the survey. All levels of editor seniority, including managing editors, as well as reporters and senior reporters were represented in the survey. Their responses gave me a starting point to begin exploring the “why” for the data I collected.
User Interviews
I combed through the survey results looking for trends and answers that piqued my interest and brought to mind follow up questions. Because the survey asked whether the respondent would participate in a user interview, I narrowed my pool of interviewees to those open to elaborating on their survey feedback.
When choosing interviewees, my goal was to ensure a well-rounded group with varying skill levels and demographic information. The resulting list of 10 interviewees reported a wide range of data competencies and frequencies in usage. They also held a variety of job titles and came from different publications, which operate independently and maintain many of their own policies and processes.
Based on the interviewee’s high-level survey responses, I created custom questions to learn more in their interview. These questions catered to the interviewee’s survey responses and allowed me to delve deeper into why they reported the limitations, frequencies and confidences they did.
The user interviews clarified and contextualized the trends that emerged from the survey. While I had internalized the trends and high-level generalizations, I needed a way to communicate my findings to stakeholders.
Personas
Personas identify types of users within a group. Each persona embodies an identity that informs how a specific group might interact with or use a product. When leadership or designers make decisions, they can refer to personas to ensure they are accounting for specific subsets of their users. They can also use personas to identify needs for new features or, in our case, trainings and processes.
They worked perfectly for this project. As I interviewed people, they naturally started sorting themselves into groups. Each group had its own identity and needed specific training, processes and tools crafted to their skill level and experience. The personas could also work together to propel each other forward based on their strengths and weaknesses.
Personas allowed me to consolidate 18 data points abstracted from the survey data and hours of user interview notes into a digestible format that highlighted the main takeaways from my research.
I named my personas from the competencies and frequencies of data usage that respondents reported in their surveys. I wanted them to incorporate the key themes I found in my research: data literacy, knowledge of available resources, documentation and time. In survey responses and interviews, these themes differed based on the profile of the person I was talking to. The personas put themes in context and made them actionable for stakeholders.
Personas:
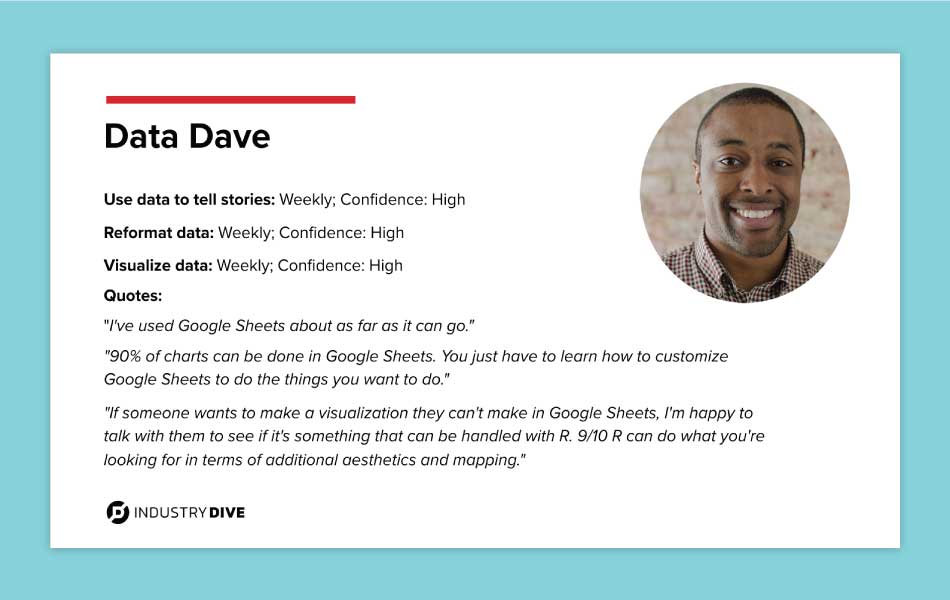
- Data Dave - a senior reporter who uses all of the data resources and tools Industry Dive provides and seizes opportunities to advance his own toolset and data literacy. He works with hundreds to thousands of rows of data and would like a tool to highlight points on charts with large sets of data, as well as a tool to better explore datasets.
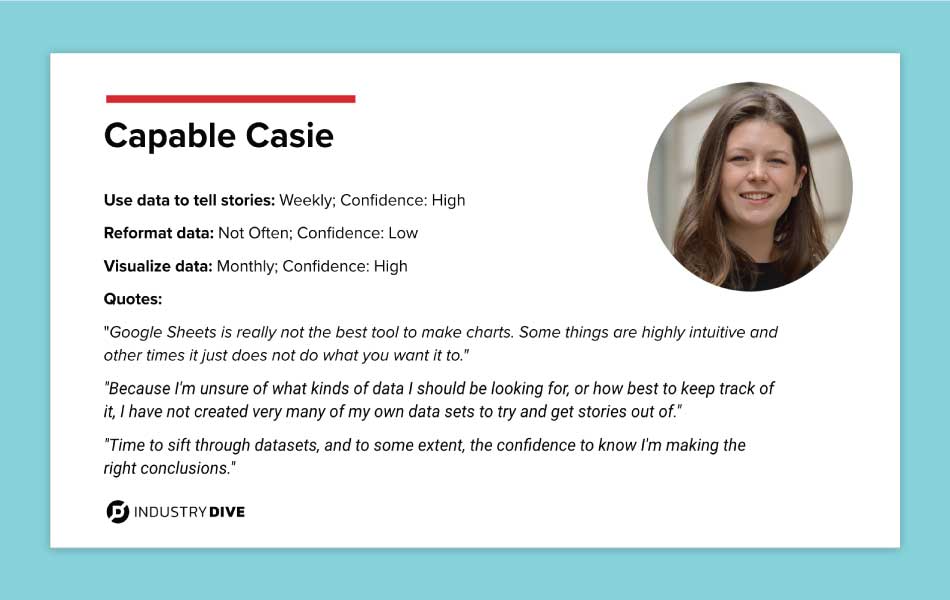
- Capable Casie - a competent editor who uses the tools available to her at the level of training Industry Dive has provided. She lacks confidence in reformatting large sets of data to find insights, because she worries she will misrepresent the numbers. Capable Casie is unsatisfied with the current tooling and believes she could do her job faster given a new set of tools. Currently, time is a large factor given her team’s size and priorities. She believes communication is essential to members of her team being able to work on data-driven projects.
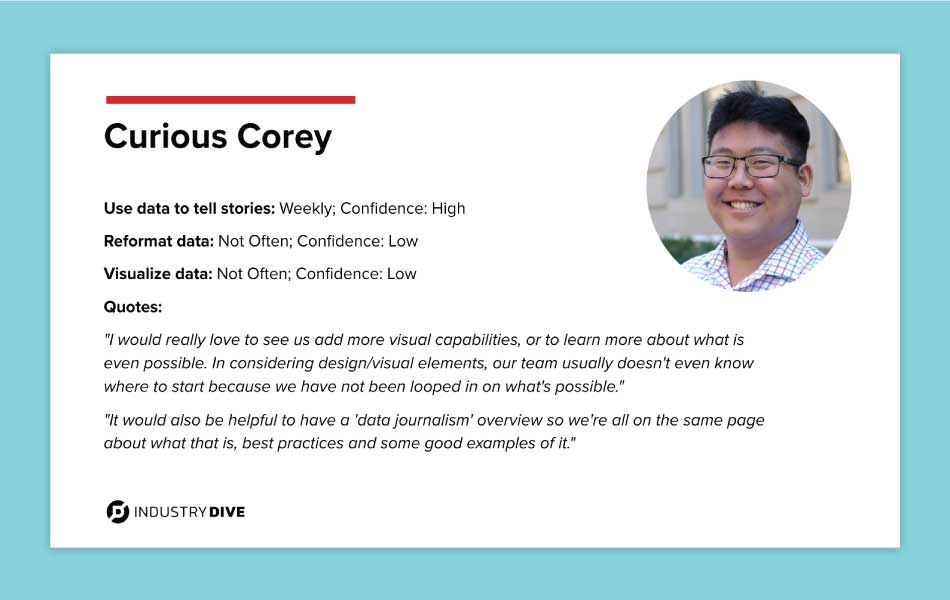
- Curious Corey - a reporter who is able to create basic graphs with the help of a template, he struggles to edit it when necessary. Because he is also uncomfortable formatting data, he is concerned with misrepresenting it in his visualizations. Curious Corey is dissatisfied with current tooling, because he believes there is a high barrier to entry and would love documentation around charting tools and best practices. He often wonders what kind of visual storytelling is possible and is open to mentorship and trainings.
Each persona also included their confidence and frequency of use with data to tell stories, reformatting data and visualizing data. Quotes from in-person interviews and the survey results accompanied these responses in the persona cards, so stakeholders could make a more personal and direct connection with the origins of each persona.
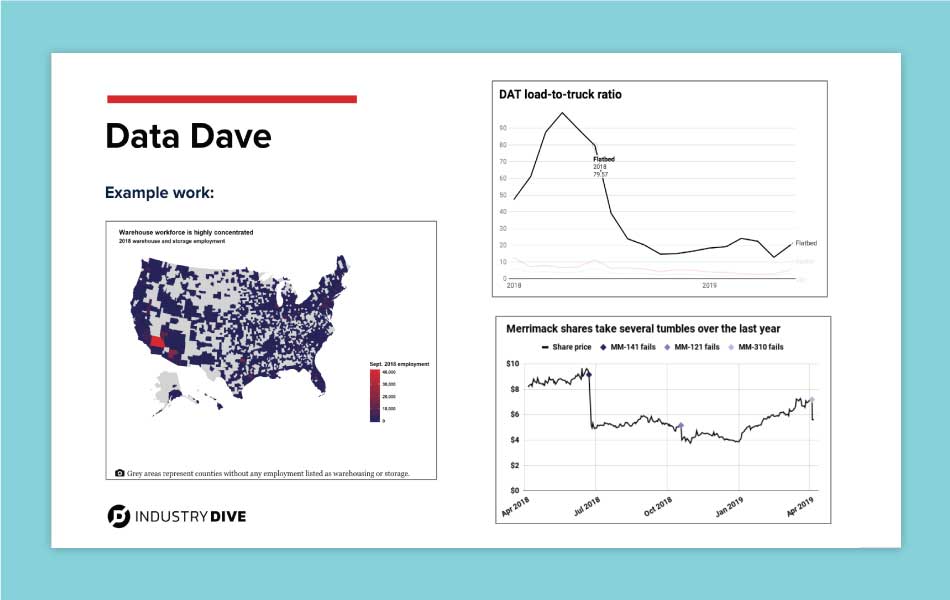
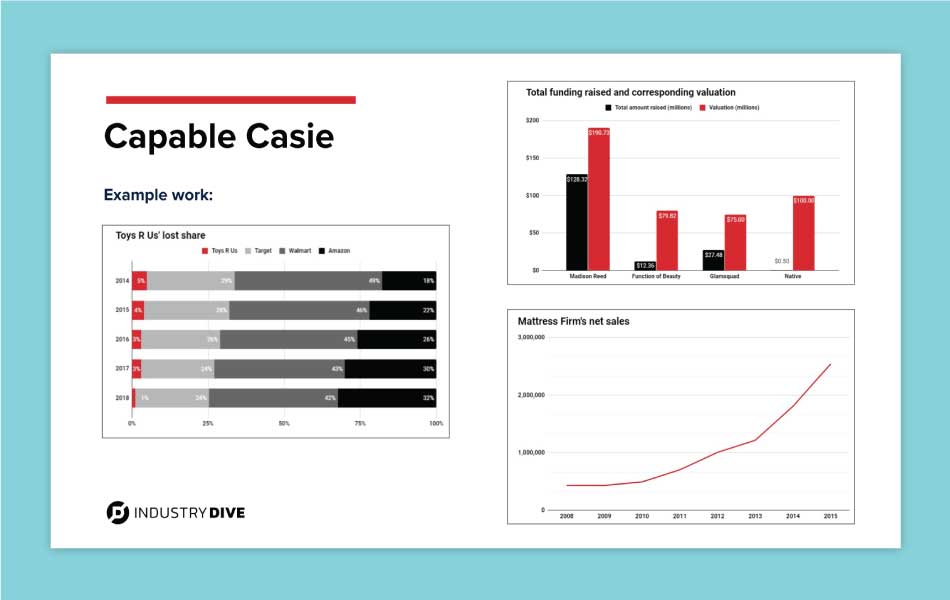
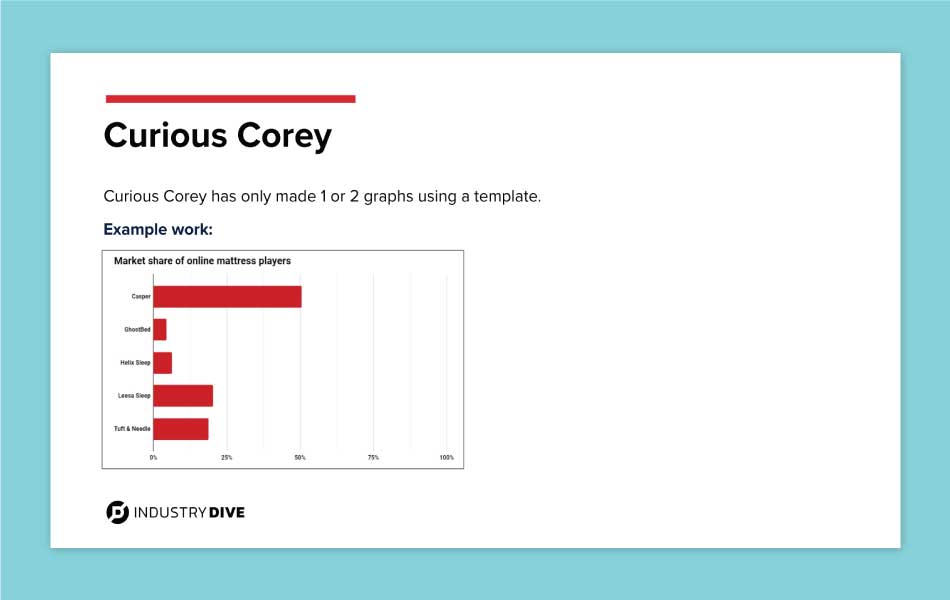
To provide a visual reference for each persona, I used examples of graphs our team members have made. The varying degree of detail and complexity visually emphasized the literacy difference between personas.
The personas I created each had three slides to communicate their views and use of data in the newsroom.
There was still a final key piece of stakeholder information missing that would help define the current makeup of the editorial team and next steps. I needed to define how many Data Daves, Capable Casies and Curious Coreys we had. If everyone were a Data Dave, the founders might be interested in turning us into an operation of data analysts. I cross referenced my personas with the survey results and developed rough percentages of each persona in the newsroom.
Finally, it was time to present my findings to the editorial stakeholders. I’d never presented personas and was a little nervous about their effectiveness. They were a hit! No, really. They led the conversation on next steps and stakeholders were able to easily reference them when asking questions and offering insights. Editorial operations can use this information to plan new processes, trainings and tooling, and include the personas as part of their language dictionary around data.
If I could do one thing differently, I probably wouldn’t have named two of my personas with the same letter “C” alliteration. I couldn’t think of better adjectives for Capable Casie and Curious Corey, though I’m sure our journalists could have.